
In this guide
Use consistent unitsInclude payload size when interpreting throughputCollect enough evidence to test the modelA broadband speed figure does not show whether the next piece of video will arrive before playback needs it. Segment timing gives a more direct question: how much playable media arrived, how long did delivery take, and how much was already buffered?
The calculation below is an original hypothetical example. It explains evidence collection; it does not estimate Dream 4K IPTV performance or specify a universal minimum connection speed.
Use consistent units
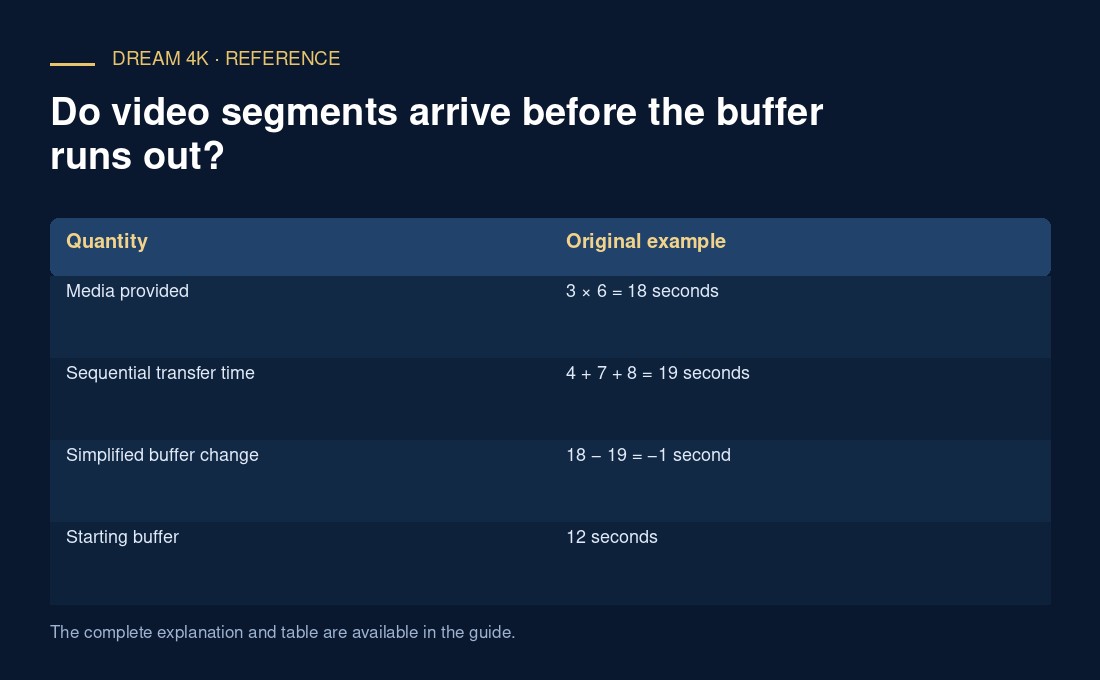
Imagine three consecutive segments, each covering six seconds of media. Their completed request times are four, seven and eight seconds. In a deliberately simplified sequential model, they add eighteen seconds of playable media while using nineteen seconds of transfer time. The resulting one-second deficit reduces the buffer, assuming playback runs continuously.
With twelve seconds initially buffered, this simplified sequence ends with eleven seconds buffered if playback runs continuously throughout. The example ignores startup, overlap between requests and separate audio resources. It shows why a late individual segment need not cause a visible pause, while repeated small deficits eventually can.
Include payload size when interpreting throughput
If one six-second segment contains 3 megabytes, its average payload rate is 3 × 8 ÷ 6 = 4 Mbit/s. A three-second transfer corresponds to approximately 8 Mbit/s of payload delivery for that request. Those are different rates describing different intervals. Use decimal megabytes and megabits consistently, or state clearly when a tool reports binary units.
A larger next segment can take longer even when delivery throughput stays unchanged. Variable-rate encoding, scene complexity and track packaging all affect size. This is why comparing request duration alone, without the media duration or payload size, can misidentify a normal size increase as a network collapse.
Collect enough evidence to test the model
Record several requests around the event, not only the slowest one. If the player exposes playable buffer depth, compare its trend with the calculated surplus or deficit. A shrinking buffer alongside late requests supports a delivery-deadline explanation. A stable buffer with rising dropped-frame counters suggests another part of the playback path deserves attention.
Use the smallest supported diagnostic sample and protect private URLs. A good report includes the time range, media durations, transfer durations and whether audio was separate. It can say that the observed delivery budget was insufficient during that interval. It cannot, without more evidence, name the ISP, Wi-Fi, origin or decoder as the cause.
| Quantity | Original example |
|---|---|
| Media provided | 3 × 6 = 18 seconds |
| Sequential transfer time | 4 + 7 + 8 = 19 seconds |
| Simplified buffer change | 18 − 19 = −1 second |
| Starting buffer | 12 seconds |
| Ending buffer in this model | 11 seconds |